Safety
We Care for the Safety & Wellbeing of People

Pence’s safety team ensures employees are properly trained, provides jobsites with best practices for prevention and proactively monitors trends to identify strategies for improvement. Whether in the field or the office, our focus on safety trumps all other obligations.
“We Care for the Safety & Wellbeing of People” is one of Pence’s core values.
Heads Up
Our Heads Up program emphasizes the importance of data and observation. Pence tracks the most common injury and accident types to give our team a “heads up” on the risks of every project. We continue to aggregate data and encourage teams to plan ahead for the safety and wellbeing of everyone on the jobsite.
Innovating Safety Practices
One of six core values, “We are driven to constantly improve” is exemplified in our safety approach with a custom-build, in-house safety app that tracks injury causes, outcomes and prevention opportunities. As we aggregate data and identify trends, our safety team is providing jobsites with best practices for prevention.
A Proactive, Data-Driven Approach to Safety
Pence Safety App
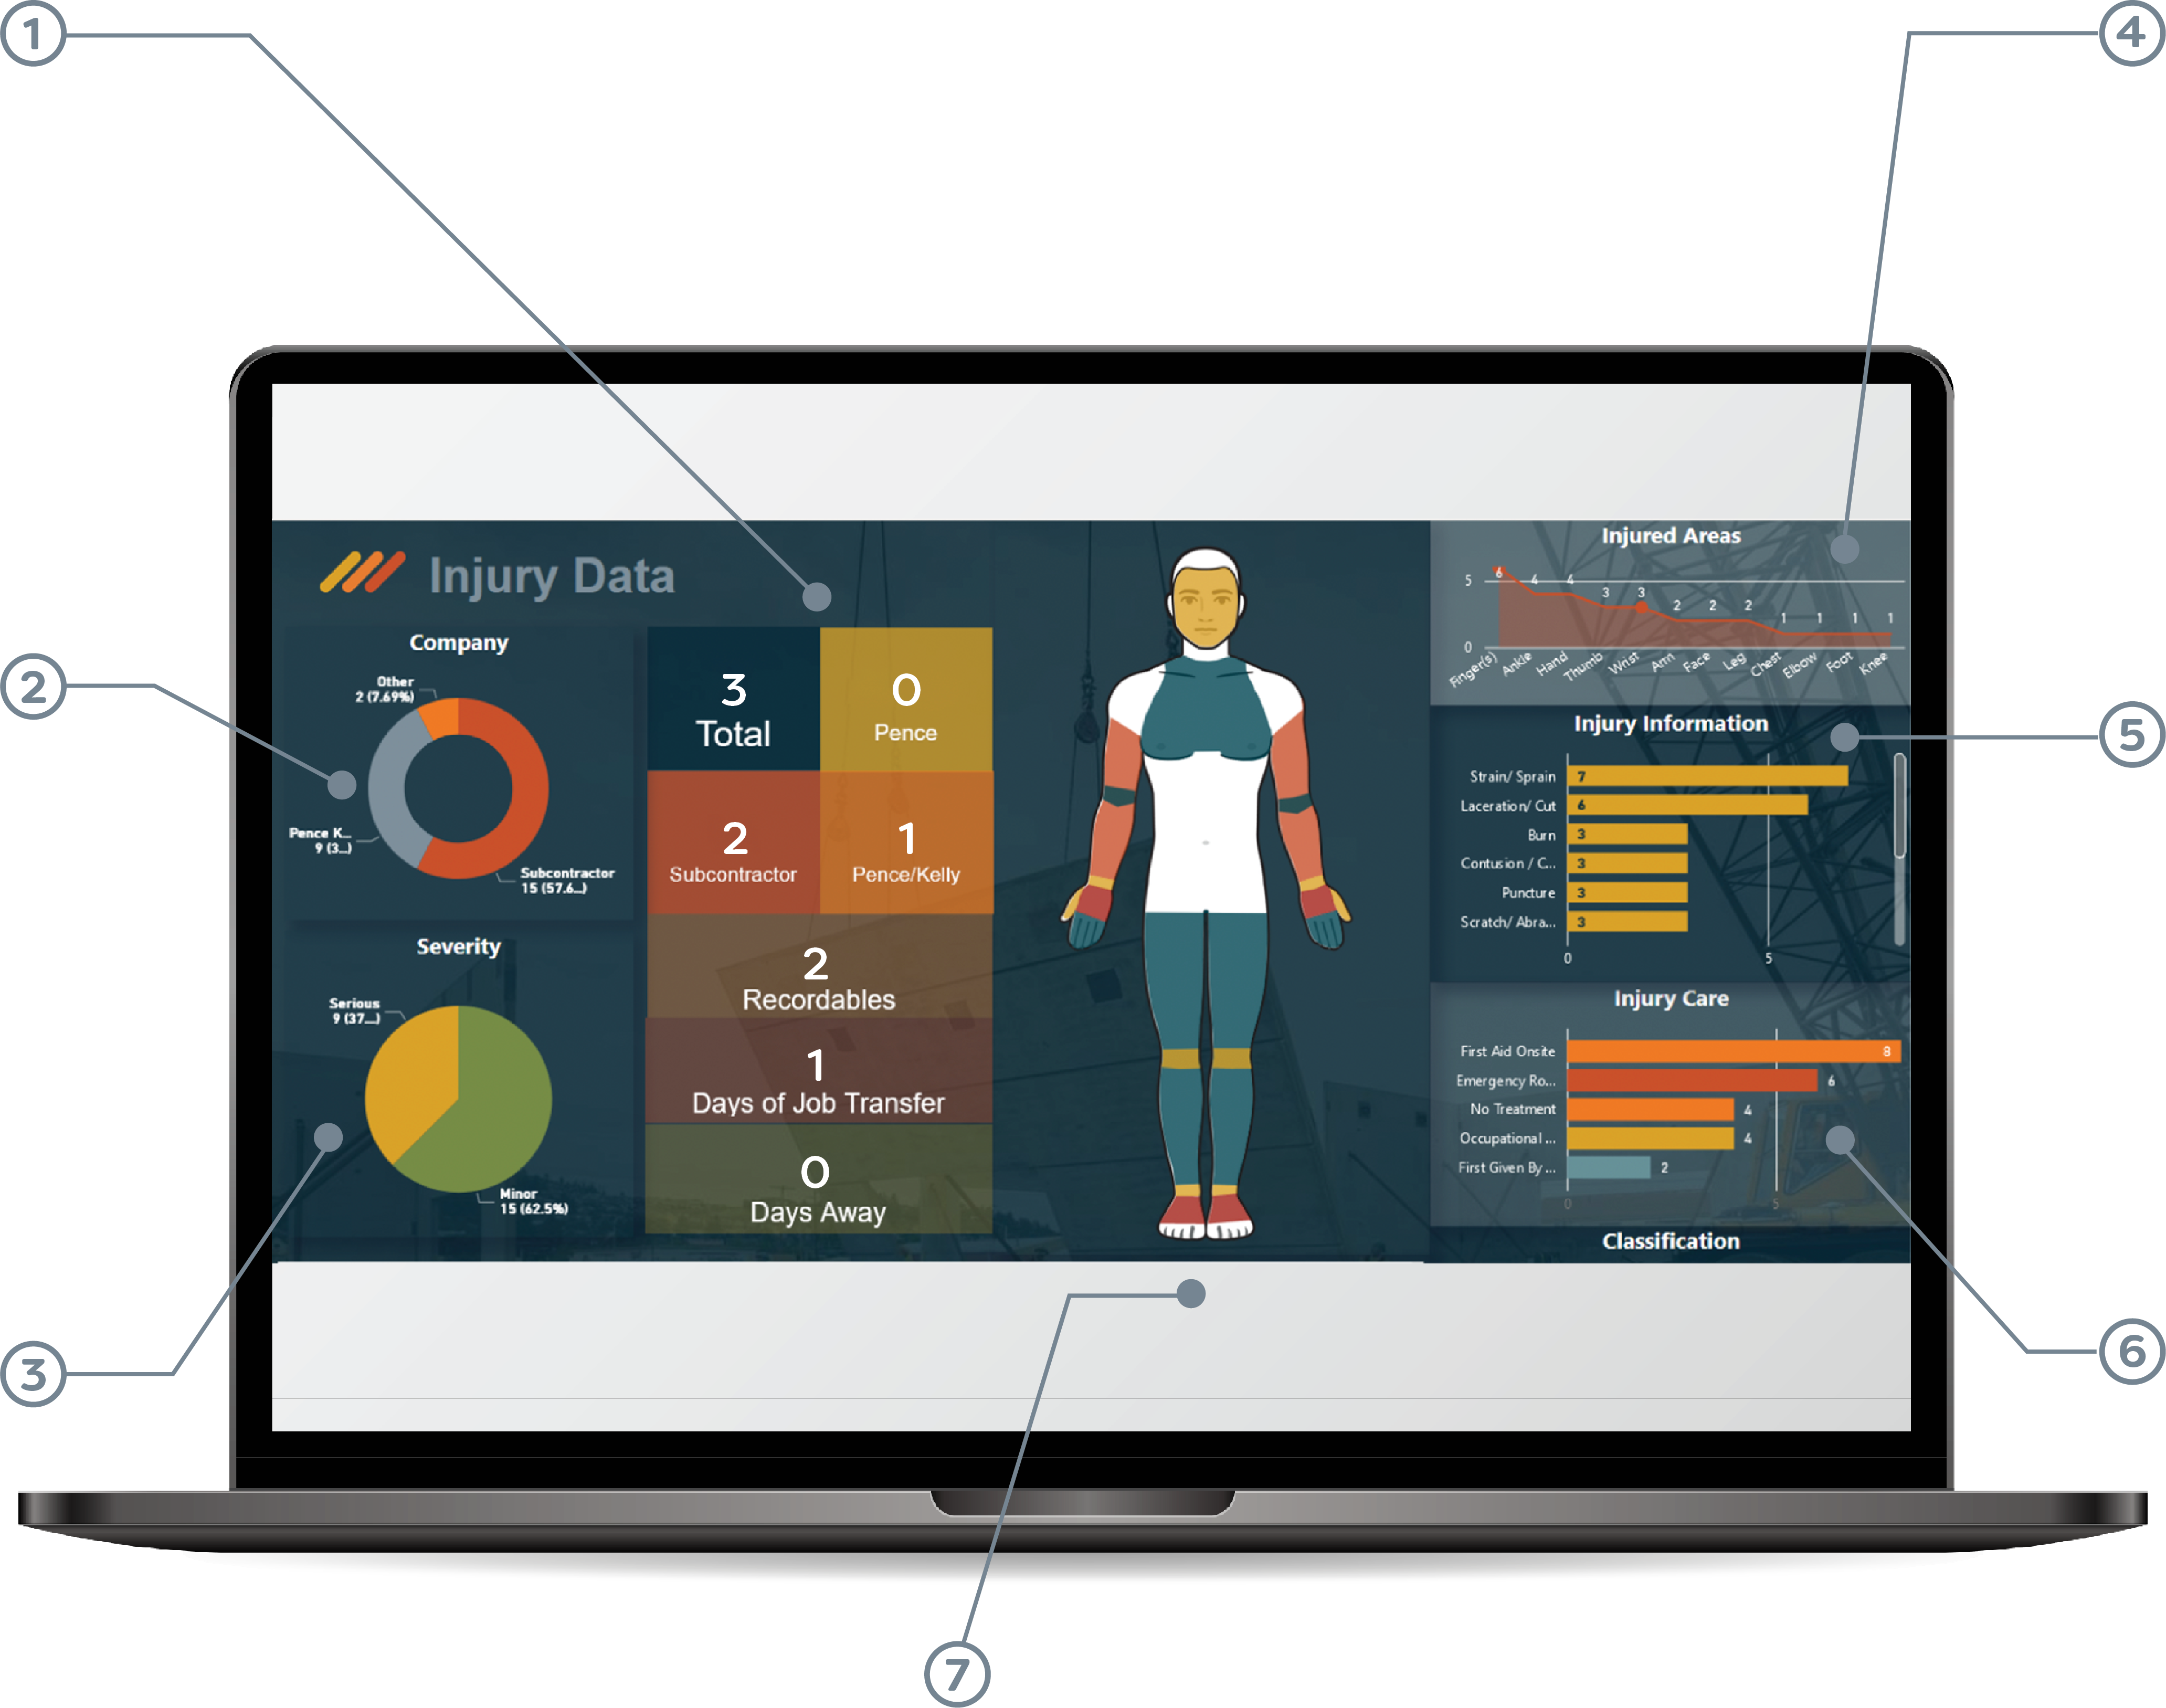
1) By The Numbers
All modules on this dashboard act as a filter to analyze specific data points. When our team clicks on a data component, this section provides a snapshot of important safety information.
2) Company Data
Company data filters and totals the number of injuries reported by Pence employees and subcontractors. This data allows us to take a proactive approach with subcontract partners that may require more training.
3) Severity
This graph tracks the severity of injuries that occur on jobsites. Our Safety Director reviews the details of an injury before classifying it as Very Serious, Serious, or Minor.
4) Injured Areas
Categorical data based on commonly injured areas is displayed in graph form. By clicking an injury area on the human figure, this graph provides data on the type of injury common to that area and the care that it requires.
5) Types of Injuries
This bar graph tracks common types of injuries. Data like this allows our safety committee to determine what job functions may need more training and discussion in Safety Meetings.
6) Injury Care
By collecting data on the level of care given in injury reports, we can better analyze the severity of injuries in greater detail. Like all data points seen here, this graph will populate information based on filters such as type or area.
7) Reported Injury Areas
This figure provides a visual representation for commonly injured areas. Clicking on a specific injury area will populate data for all other dashboard components.
© 2026 Pence Contractors.
All Rights Reserved.